Central Texas housing market holds steady in October with balanced inventory and rising pending sales
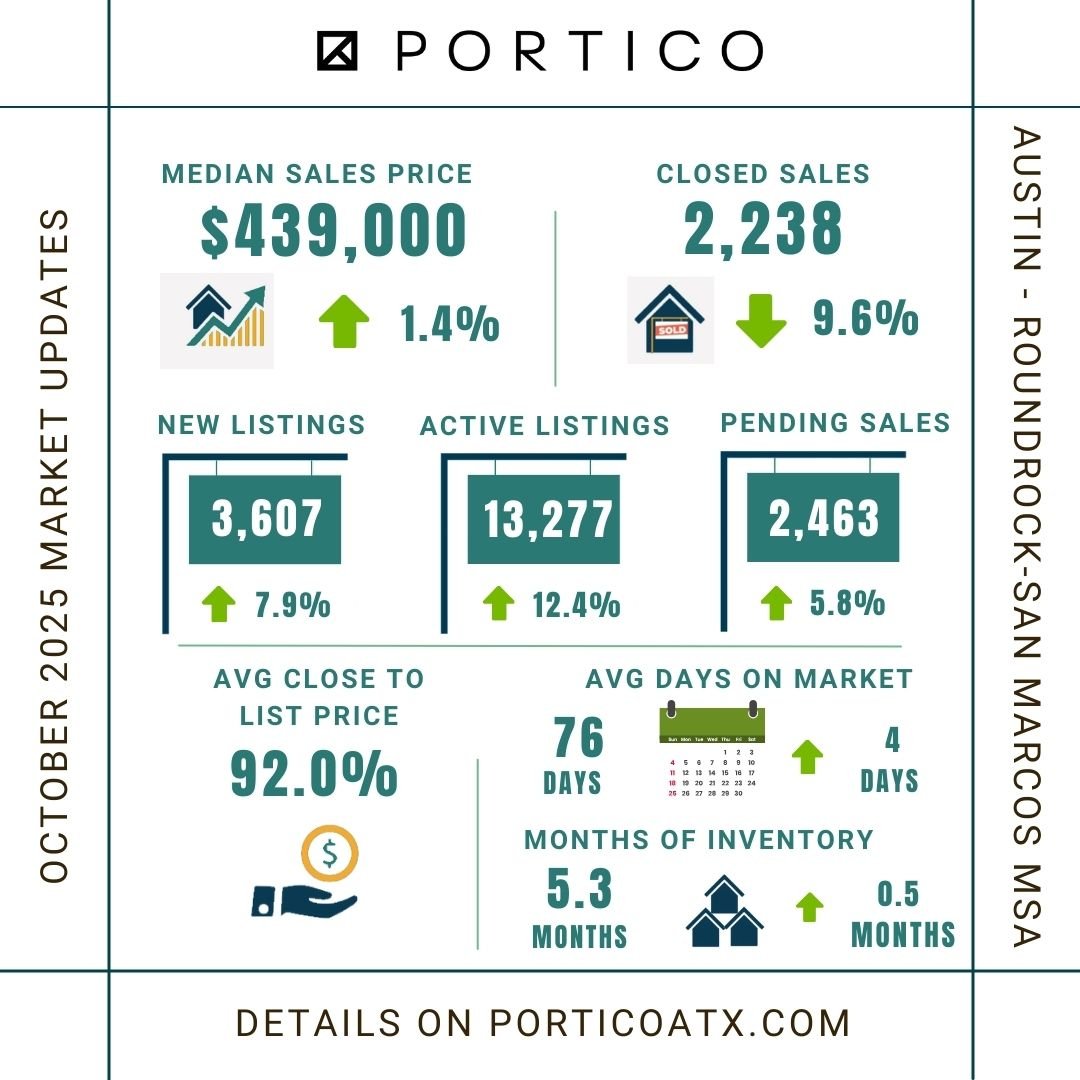
AUSTIN, Texas — According to the October Central Texas Housing Report released by Unlock MLS, pending sales increased 5.8% to 2,463 sales, and inventory ticked up to 5.3 months across the Austin-Round Rock-San Marcos MSA. Marking the seventh straight month of price stability, median sales price rose 1.4% year over year to $439,000, while closed sales dipped 9.6% year over year to 2,238 sales across the MSA.
Vaike O’Grady, research advisor at Unlock MLS, said the market’s performance is a sign of continued normalization and a balanced housing market.
“After several years of volatility, what we’re seeing now is a housing market that’s functioning the way it should. Pricing has been steady for months, inventory is in balance and the Federal Reserve’s recent interest rate cuts have boosted buyer confidence, as shown in increased pending sales activity. Homes that are priced right and well-presented are still selling quickly and close to asking price. The consistency we’re seeing is a healthy sign for what we can anticipate in 2026 and continued long-term growth.”
Brandy Wuensch, 2025 Unlock MLS and ABoR president, added that stability also reinforces having a trusted real estate professional to guide you through the full picture is more valuable than ever in today’s market.
“Affordability challenges remain in Central Texas, but we’re seeing more buyers re-enter the market as pricing holds steady and inventory expands. REALTORS® bring more than just transactional support—they help clients understand the true costs of homeownership, identify the right opportunities and navigate today’s evolving market conditions with confidence. This is a moment for thoughtful, informed decision-making, and that’s exactly where a professional agent can make all the difference.”
Austin-Round Rock-San Marcos MSA
October 2025 - For Sale
-
2,238 – Residential homes sold, 9.6% less than October 2024.
-
$439,000 – Median price for residential homes, 1.4% more than October 2024.
-
3,607 – New home listings on the market, 7.9% more than October 2024.
-
13,227 – Active home listings on the market, 12.4% more than October 2024.
-
2,463 – Pending sales, 5.8% more than October 2024.
-
5.3 – Months of inventory, 0.5 months more than October 2024.
-
$1,323,120,444 – Total dollar volume of homes sold, 4.8% less than October 2024.
-
92.0% – Average close to list price, compared to 92.4% in October 2024.
October 2025 - For Lease
-
1,916 – Closed leases, 5.1% less than October 2024.
-
$2,150 – Median price for rent, 2.1 less than October 2024.
-
2,580 – New lease listings on the market, 2.5% more than October 2024.
-
5,812 – Active lease listings on the market, 5.1% more than October 2024.
-
2,102 – Pending leases, 1.7% more than October 2024.
-
2.8 – Months of inventory, 0.3 months more than October 2024.
-
$4,718,277 – Total dollar volume of leases, 4.0% less than October 2024.
-
94.1% – Average close to list price, compared to 93.4% in October 2024.
City of Austin
October 2025 - For Sale
-
786 – Residential homes sold, 0.5% more than October 2024.
-
$552,500 – Median price for residential homes, 0.5% more than October 2024.
-
1,321 – New home listings on the market, 12.7% more than October 2024.
-
4,698 – Active home listings on the market, 9.2% more than October 2024.
-
870 – Pending sales, 14.9% more than October 2024.
-
5.6 – Months of inventory, 0.4 months more than October 2024.
-
$626,321,210 – Total dollar volume of homes sold, 6.1% more than October 2024.
-
92.1% – Average close to list price, compared to 91.3% in October 2024.
October 2025 - For Lease
-
925 – Closed leases, 5.8% less than October 2024.
-
$2,350 – Median price for rent, 1.9% less than October 2024.
-
1,229 – New lease listings on the market, 3.1% less than October 2024.
-
2,804 – Active lease listings on the market, 1.6% more than October 2024.
-
1,029 – Pending leases, 4.9% more than October 2024.
-
2.7 – Months of inventory, 0.1 months more than October 2024.
-
$2,540,572 – Total dollar volume of leases, 5.0% less than October 2024.
-
94.9% – Average close to list price, compared to 93.6% in October 2024.
Travis County
October 2025 - For Sale
-
1,048 – Residential homes sold, 1.6% less than October 2024.
-
$510,000 – Median price for residential homes, 2.0% more than October 2024.
-
1,769 – New home listings on the market, 11.5% more than October 2024.
-
6,407 – Active home listings on the market, 10.4% more than October 2024.
-
1,131 – Pending sales, 13.8% more than October 2024.
-
5.9 – Months of inventory, 0.4 months more than October 2024.
-
$765,848,903 – Total dollar volume of homes sold, 3.6% more than October 2024.
-
91.8% – Average close to list price, compared to 91.7% in October 2024.
October 2025 - For Lease
-
1,032 – Closed leases, 8.7% less than October 2024.
-
$2,300 – Median price for rent, 1.7% less than October 2024.
-
1,448 – New lease listings on the market, flat compared to October 2024.
-
3,304 – Active lease listings on the market, 2.6% more than October 2024.
-
1,157 – Pending leases, 1.3% more than October 2024.
-
4.3 – Months of inventory, 0.1 less than October 2024.
-
$2,799,674 – Total dollar volume of leases, 7.3% less than October 2024.
-
93.9% – Average close to list price, compared to 93.1% in October 2024.
Williamson County
October 2025 - For Sale
-
782 – Residential homes sold, 12.5% less than October 2024.
-
$414,000 – Median price for residential homes, 3.6% less than October 2024.
-
1,144 – New home listings on the market, 11.1% more than October 2024.
-
4,146– Active home listings on the market, 20.5% more than October 2024.
-
860 – Pending sales, 3.7% more than October 2024.
-
5.0 – Months of inventory, 1.0 month more than October 2024.
-
$368,477,418 – Total dollar volume of homes sold, 14.5% less than October 2024.
-
91.8% – Average close to list price, compared to 93.1% in October 2024.
October 2025 - For Lease
-
690 – Closed leases, 3.3% more than October 2024.
-
$2,100 – Median price for rent, 0.2% more than October 2024.
-
839 – New lease listings on the market, 6.9% more than October 2024.
-
1,825 – Active lease listings on the market, 7.9% more than October 2024.
-
719 – Pending leases, 5.3% more than October 2024.
-
2.3 – Months of inventory, 0.3 months more than October 2024.
-
$1,477,444 – Total dollar volume of leases, 3.1% more than October 2024.
-
94.2% – Average close to list price, compared to 93.8% in October 2024.
Hays County
October 2025 - For Sale
-
302– Residential homes sold, 16.1% less than October 2024.
-
$394,900 – Median price for residential homes, 11.2% more than October 2024.
-
467 – New home listings on the market, 13.2% less than October 2024.
-
1,746 – Active home listings on the market, 1.4% less than October 2024.
-
337 – Pending sales, 4.8% less than October 2024.
-
4.6 – Months of inventory, flat compared to October 2024.
-
$150,532,527 – Total dollar volume of homes sold, 5.4% less than October 2024.
-
93.1% – Average close to list price, compared to 93.0% in October 2024.
October 2025 - For Lease
-
150 – Closed leases, 12.8% less than October 2024.
-
$2,000 – Median price for rent, 0.1% more than October 2024.
-
217 – New lease listings on the market, 4.0% less than October 2024.
-
526 – Active lease listings on the market, 5.8% more than October 2024.
-
173 – Pending leases, 7.5% less than October 2024.
-
2.7 – Months of inventory, 0.2 more than October 2024.
-
$338,782 – Total dollar volume of leases, 8.3% less than October 2024.
-
94.1% – Average close to list price, compared to 93.7% in October 2024.
Bastrop County
October 2025 - For Sale
-
88 – Residential homes sold, 26.7% less than October 2024.
-
$340,000 – Median price for residential homes, 5.5% less than October 2024.
-
156 – New home listings on the market, 4.7% more than October 2024.
-
772 – Active home listings on the market, 17.9% more than October 2024.
-
107 – Pending sales, 8.5% less than October 2024.
-
7.4 – Months of inventory, 1.3 months more than October 2024.
-
$33,434,904 – Total dollar volume of homes sold, 30.8% less than October 2024.
-
91.0% – Average close to list price, compared to 92.0% in October 2024.
October 2025 - For Lease
-
32 – Closed leases, 3.0% less than October 2024.
-
$1,900 – Median price for rent, flat compared to October 2024.
-
50 – New lease listings on the market, 13.6% more than October 2024.
-
110 – Active lease listings on the market, 2.8% more than October 2024.
-
43 – Pending leases, 19.4% more than October 2024.
-
3.0 – Months of inventory, flat compared to October 2024.
-
$64,055 – Total dollar volume of leases, 1.6% less than October 2024.
-
94.8% – Average close to list price, flat compared to October 2024.
Caldwell County
October 2025 - For Sale
-
18 – Residential homes sold, 52.6% less than October 2024.
-
$242,750– Median price for residential homes, 11.0% less than October 2024.
-
71 – New home listings on the market, 82.1% more than October 2024.
-
208 – Active home listings on the market, 47.5% more than October 2024.
-
28 – Pending sales, 20.0% less than October 2024.
-
6.5 – Months of inventory, 3.0 months more than October 2024.
-
$4,826,692 – Total dollar volume of homes sold, 58.6% less than October 2024.
-
93.6% – Average close to list price, compared to 93.8% in October 2024.
October 2025 - For Lease
-
12 – Closed leases, 29.4% less than October 2024.
-
$1,750 – Median price for rent, flat compared to October 2024.
-
27 – New lease listings on the market, 68.8% more than October 2024.
-
49 – Active lease listings on the market, 122.7% more than October 2024.
-
9 – Pending leases, 52.6% less than October 2024.
-
3.5 – Months of inventory, 2.0 months more than October 2024.
-
$20,772 – Total dollar volume of leases, 26.2% less than October 2024.
-
96.9% – Average close to list price, compared to 96.8% in October 2024.